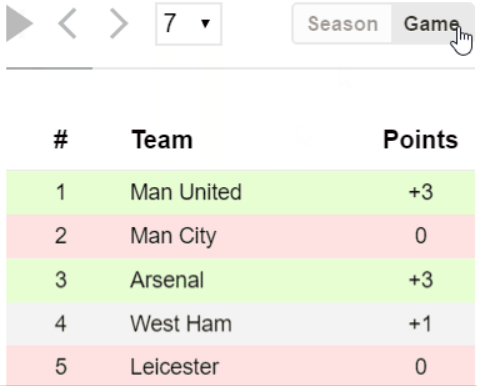
One day I caught myself staring at the English Premier League table trying to remember the course of the season:
-
Did Leicester took the lead from the start or was it a heroic finish that accounted for the victory?
-
How did the winter transfers affect the results?
-
I remember Southampton being deeeeeep down the table but they somehow have qualified for the Europa League. How did they manage to climb up?
-
How did the Manchester derbies go?
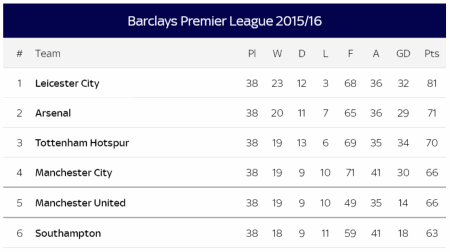
The table hadn’t got any answers for me. So I began researching the alternatives.
Form/Streak
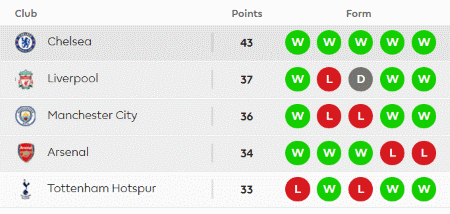

Form and streak columns help to recap the nearest past and are useful when a season is on and you’re watching closely. However, they are of no avail after a season is finished.
They have become popular and are now featured on both Premier League and NBA websites.
Color-coded Table

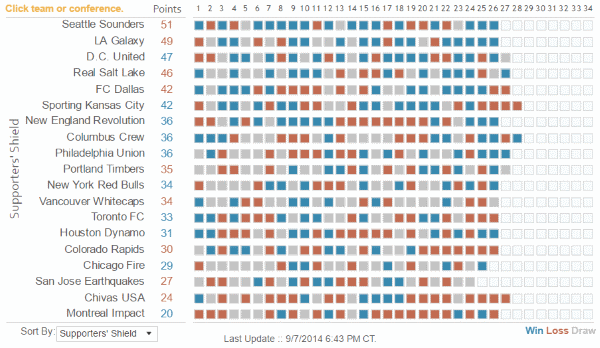
One way to see the course of the whole season is through a color-coded table.
Learn information at your pace and drill down to a particular round…until you get hit by the overwhelming information density. After a minute your brain begs you to stop and navigate back to cat videos on Youtube.
Also, there is no way to tell who was at the top after, say, the Belgium GP — Hamilton or Rosberg.
Historical Standings
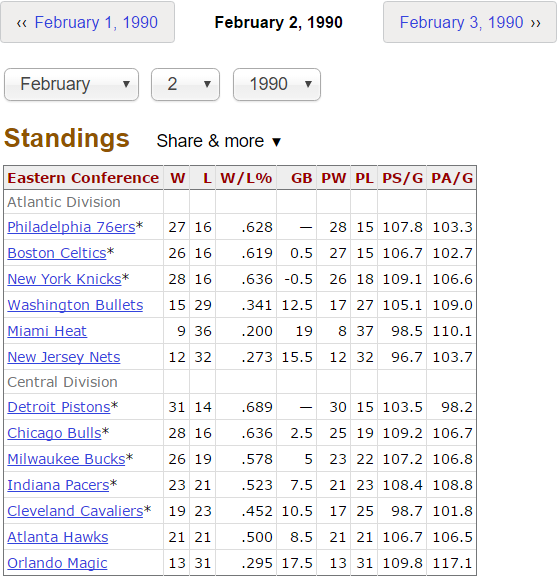
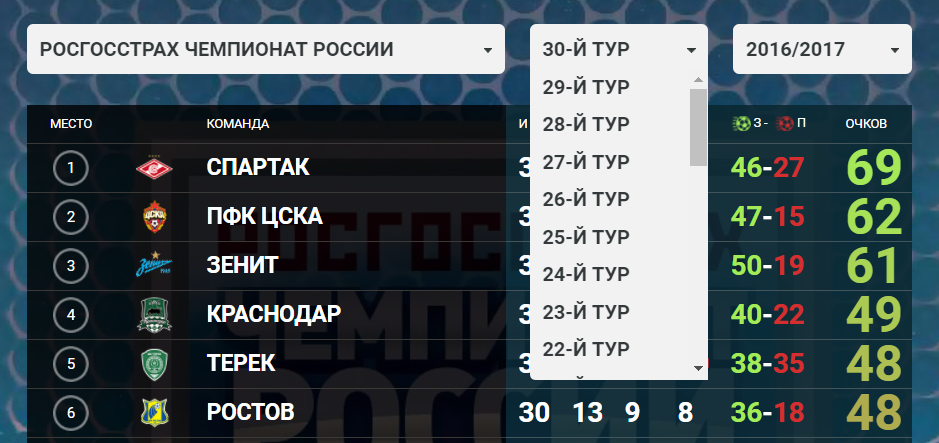
A true geek can dare to find a trend by comparing standings for a pair of dates. However, it turned out that even I am not geekish enough (that means something, believe me).
But there’s some good news here! The data is just laying around waiting for somebody to show it properly.
Standings + Positions History + Results
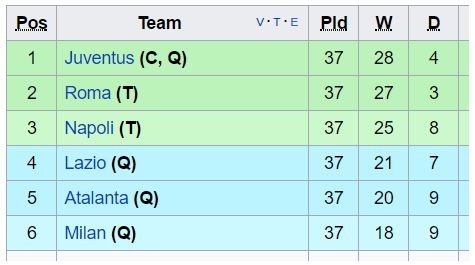
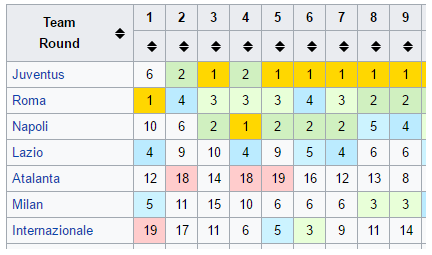
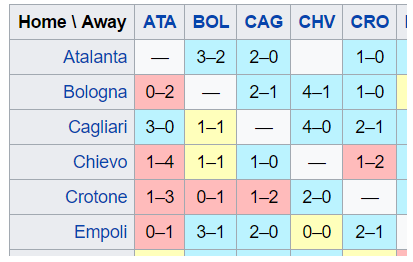
This combination is a standard for soccer football season pages on Wikipedia.
It has almost no limit for exploration…if you love to scroll and have an infinite short-term memory capacity.
Custom-built System
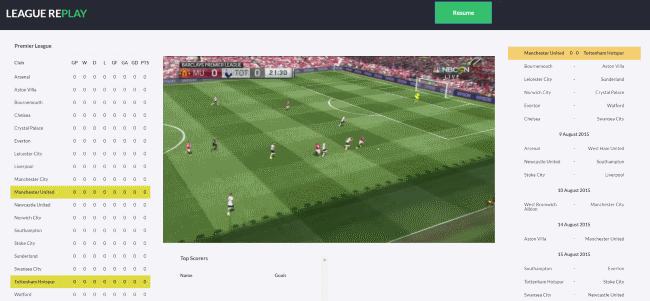
There is a true season replay with video highlights for EVERY game of the English Premier League.Pour a pint and relax in your seat.
However, this might be too much if you haven’t got a spare hour and a pack of Guinness in the fridge.
There’s also a problem from a developer’s perspective: systems like this are not reusable. Creating a replay for any other season requires days or even weeks of work.
Visualization
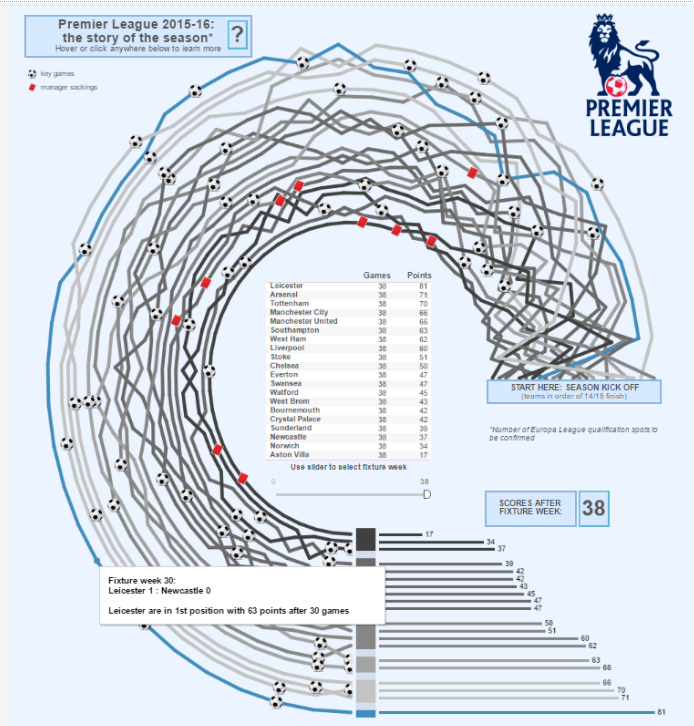
A plain line chart quickly turns into a mess as the number of teams and rounds increases beyond, so one should look for some creative options.
Check out the ways to reimagine sports standings by Tableau users. There a few dozens of visualizations out there but none of them are both intuitive and detailed enough to replace a simple standings table.
Animated Standings
Well, I thought, if plain old standings are that good, why not work on enhancing them instead of inventing some super graphics that only a bunch of dataviz nerds would understand?
What a great idea! As it always turns out, some asian kid guy did this in 2011
when nothing was more sexy than JQuery:
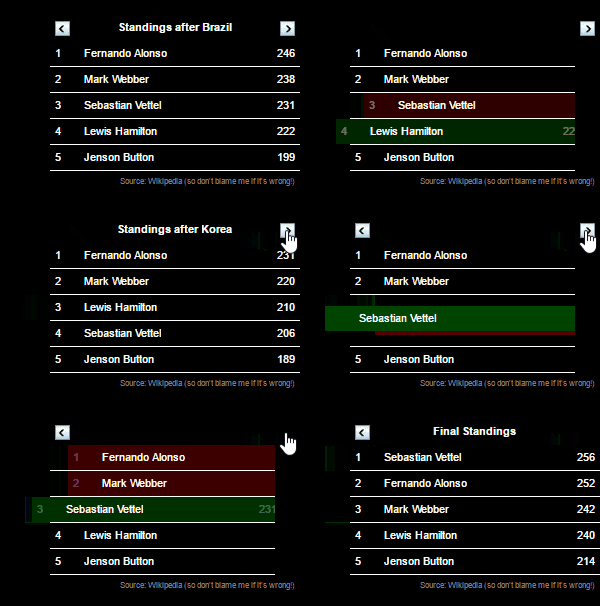
Unfortunately, the script is far from easy to use and hasn’t been updated for years.
Standings Made Right
So we teamed up with Daria and Vitali to make standings great again for the first time.
And today is the day! We’re happy to announce Replay Table, the standings of the data era:
Play around, travel through time, drill down to a team, explore the sparklines. Oh yeah.
Replay Table
So what exactly is Replay Table? It’s an open-source javascript library on top of D3.js designed for visualizing sport season results.
It has a straightforward declarative interface. A table is just a div with replayTable class and a bunch of data- attributes:
<div class="replayTable"
     data-source="/replay/assets/data/football/2016-2017/english-premier-league.json"
     data-format="football-data.org"
     data-order-by="points,goalsDifference,goalsFor"
     data-visualizer="sparklines">
</div>
Include the scripts and the stylesheet in the head section of the page, apply some magic to the body — and you’re ready to go:
    <head>
        ...
        <script type="text/javascript" src="https://d3js.org/d3.v4.min.js"></script>
        <script type="text/javascript" src="https://unpkg.com/replay-table/dist/replay-table.min.js"></script>
        <link rel="stylesheet" type="text/css" href="https://unpkg.com/replay-table/dist/replay-table.css">
    </head>
    <body>
        ...
        <script type="text/javascript">replayTable.magic()</script>
    </body>
If you’d like to have more control over the table I am happy to say these three words to you: npm install replay-table.
Check out the docs to learn how the library works and what parameters are available for customization.
Reusability
But what if you hate those british snobs und wollen den echten Fußball sehen. Kein Problem:
All you have to do is replace the data-source attribute value with a proper json/csv.
Not into chasing a ball? No problemo, here is an Formula One season for you:
The source code looks like this:
<div class="replayTable"
    data-source="/replay/assets/data/formula-one/2016/formula-one-drivers.csv"
    data-preset="f1"
    data-extra-columns-number="1"
    data-columns="position,item,Team,points,points.change"
    data-labels="#,Driver,Team,Points">
</div>
We’ve also made a table for the NBA season to show the flexibility of Replay Table.
License
We released Replay Table under MIT license so you don’t need a permission to use it even on a commercial website.
We’d be happy to see oldschool standings giving way to the new visualizations.
